The Index Fell. The Market Didn't.
The Nasdaq had its ugliest week in months. VL breadth data went up. Both are true — and the gap between them is the only thing worth reading about this week.

Here’s the number that should not be possible.
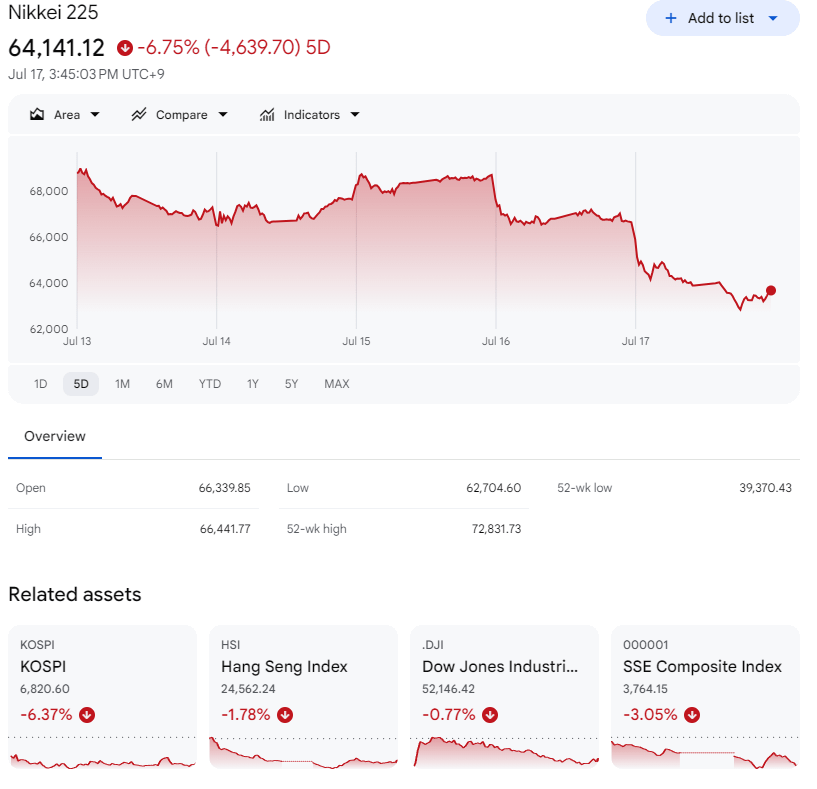
This week the Nasdaq fell 2.9%. The S&P 500 fell 1.55%. Japan’s Nikkei fell 6.4%. Chinese mainland stocks fell more than 5%. By every headline you saw, this was a bad week — a global sell-off, the kind that makes people check their 401(k) on a Saturday.

And the share of stocks trading above the prices where institutions actually transact went up. 57.7% Monday, 58.8% Friday.
Both facts are true. They’re the same fact told from two different distances — and the distance between them is worth more than anything else I can show you this week.
A scale, not a census
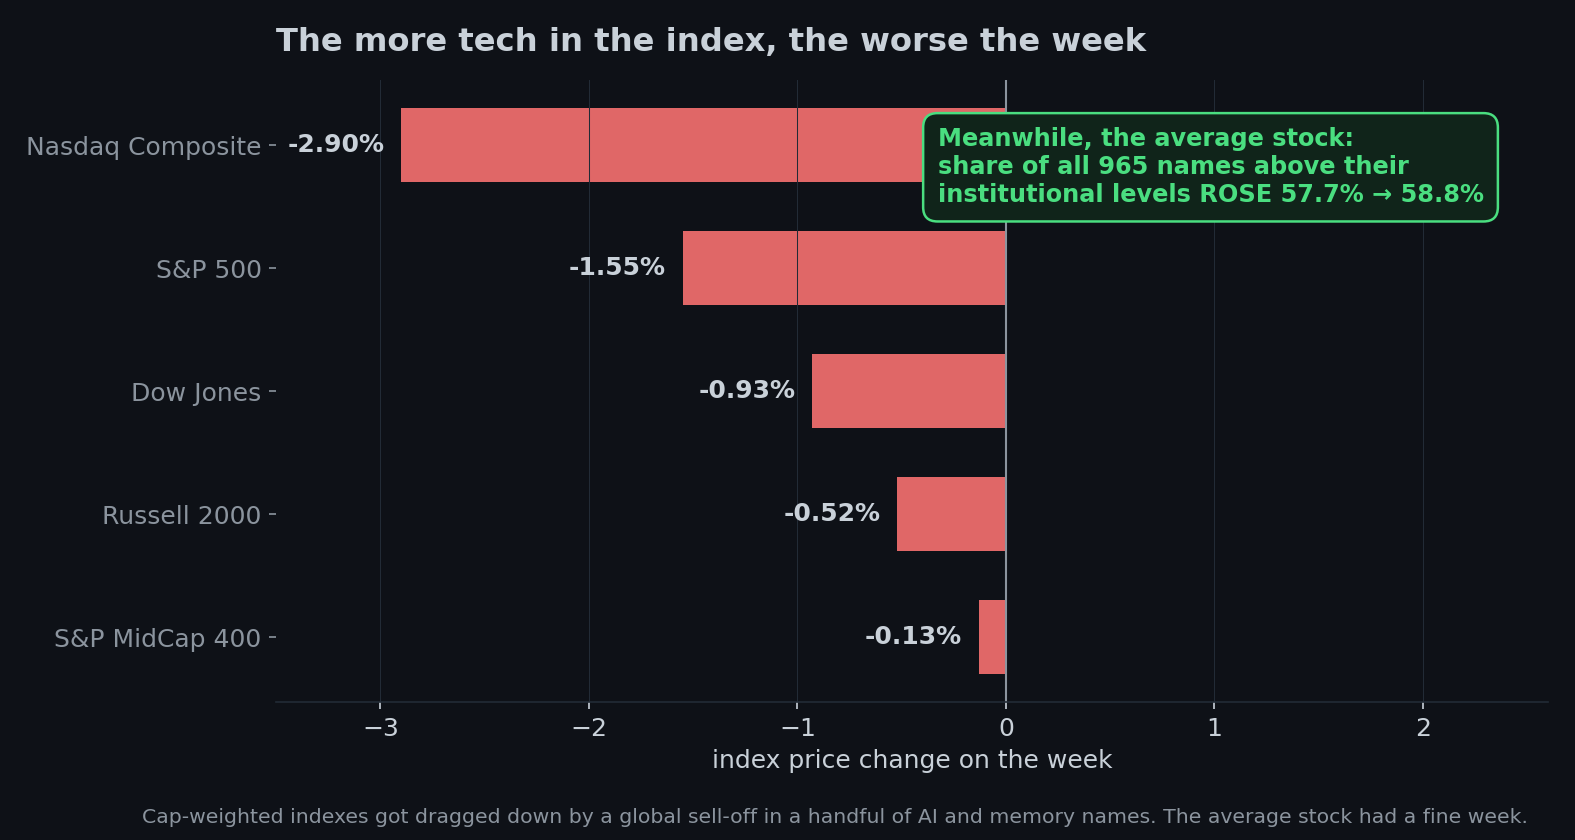
Look at the week’s losses in order, and something falls out of them immediately. The Nasdaq — the most technology-stuffed index we have — fell 2.9%. The S&P 500, less tech-heavy, fell 1.55%. The Dow, less again, fell 0.93%. The small-cap Russell 2000 fell half a percent. And the S&P MidCap 400, the least glamorous index in America, fell 0.13%.
That’s not five markets having five different weeks. That’s one market, sliced five ways, and the slices with more technology in them lost more money. The gradient is the story. Nothing else explains a line that clean.
Which brings us to the plumbing, and to why “the market fell 3%” is one of the most misleading true sentences in finance.
Here’s the thing about the S&P 500 that everyone knows and nobody quite feels: it’s a scale, not a census. It weighs the market. It doesn’t count it. Every dollar of market value gets a vote; every company does not. After two years of AI enthusiasm, a handful of enormous names sit on the heavy end of that scale, and what they do is most of what the needle says.
This week the heaviest things on the scale got lighter. Almost everything else got heavier. The needle went down. That isn’t the scale malfunctioning. That’s what you get for asking a scale to describe a crowd.
Thursday, the whole week in one day
If you want the compressed version, look at Thursday.
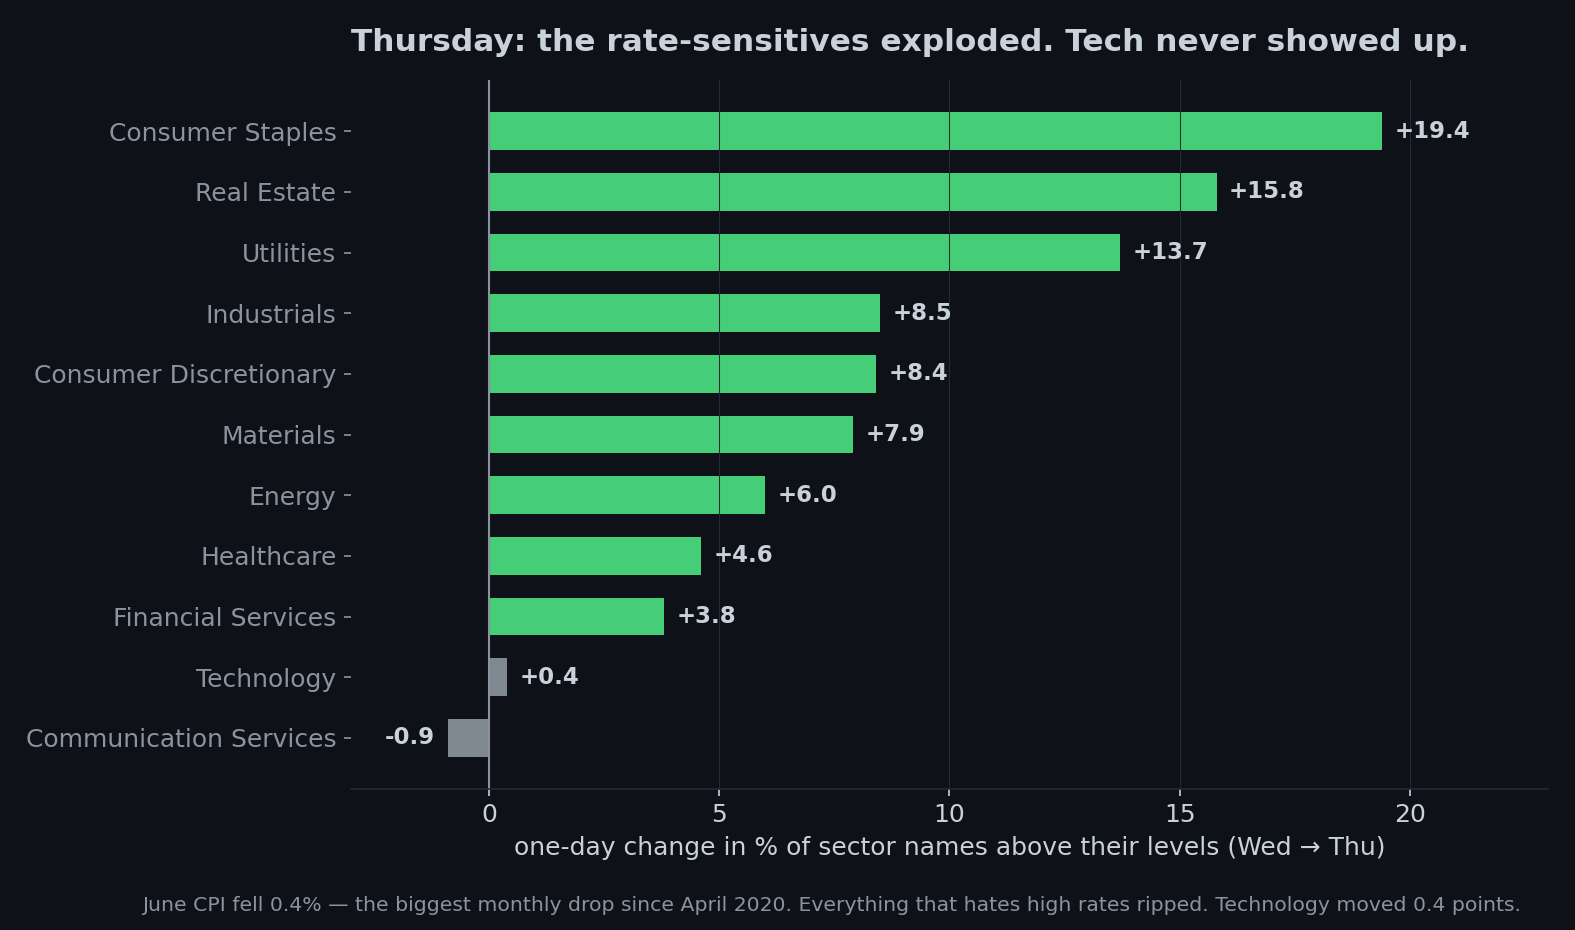
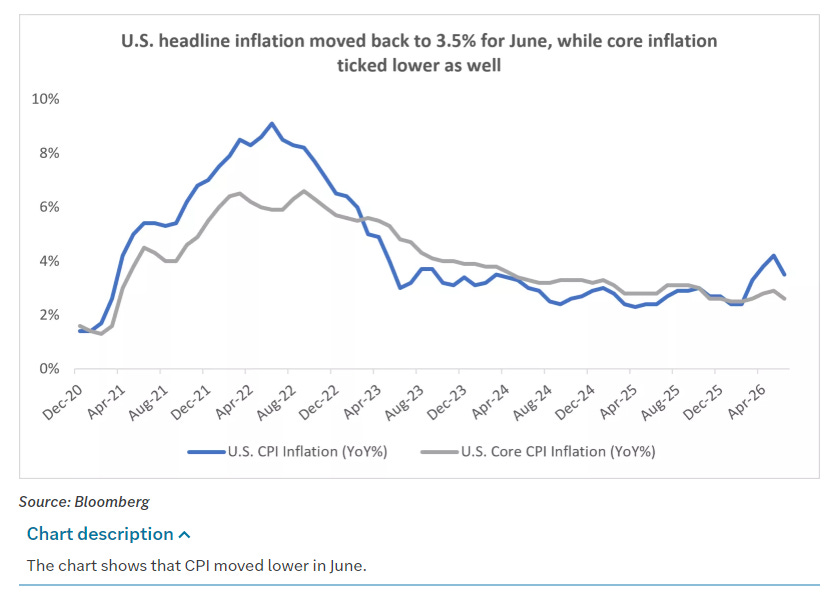
June’s inflation report landed midweek and it was a gift: consumer prices fell 0.4% on the month — the biggest one-month drop since April 2020 — with energy costs down 5.7%. Core inflation didn’t budge. Producer prices fell too. The implied odds of a July rate hike collapsed from roughly 40% to about 14% in a matter of days.
Then Thursday happened, and VL’s dashboard lit up like a switchboard. Consumer Staples jumped 19.4 points in a single session. Real Estate jumped 15.8. Utilities jumped 13.7. Industrials, discretionary, materials, energy, healthcare, financials — all up. Nine of eleven sectors green, most of them substantially.
Technology moved 0.4 points. Communication Services went down.
And the S&P 500 — the thing people call “the market” — fell about half a percent that day.
Sit with that. On a day when nine of eleven sectors rallied and the rate-sensitive corners of the market had one of their best sessions of the year, the headline index went down, because the two sectors that didn’t participate happen to be the two that weigh the most. If you watched the tape, you saw a red day. If you watched stocks, you saw a party.
That’s not a glitch. It’s what a cap-weighted average does. It’s working exactly as designed. The design is just a poor description of what happened to most stocks.

I’m not the only one with this data anymore
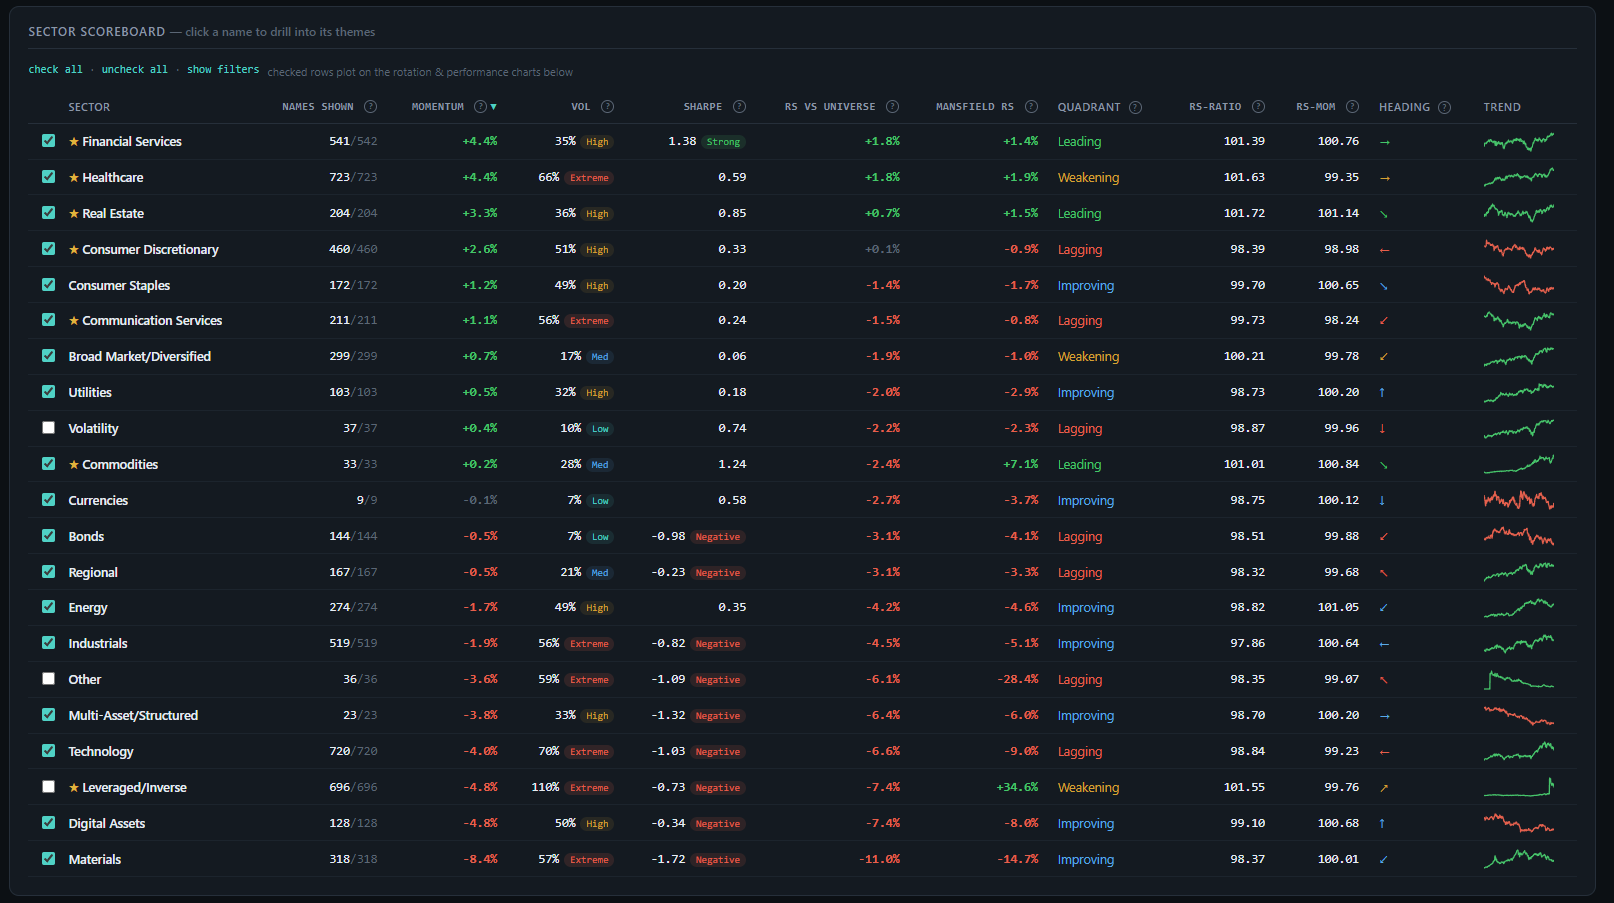
If you’re a weekly reader, you’re already ahead of the curve. For four straight weeks I’ve told you the same thing off my own breadth board: Financials and Healthcare are the strongest sectors I have, and Technology is stuck near the bottom. Price returns for every S&P sector since June 1 rank as follows:
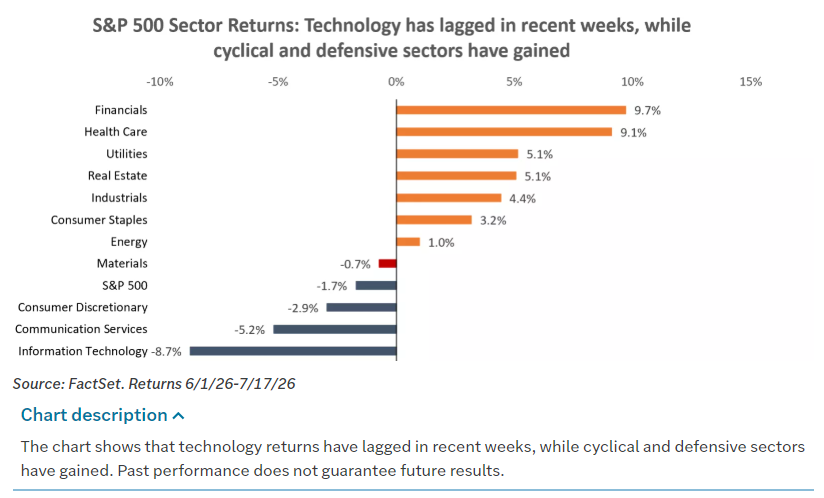
Financials +9.7%. Health Care +9.1%. Then utilities, real estate, industrials, staples, energy — all positive. At the bottom: Communication Services −5.2% and Information Technology −8.7%.
Same order. Different instrument, different method, completely independent — and it lands on my ranking almost exactly. The classic “Market leadership is rotating.”
But the number in that chart I can’t stop looking at isn’t any single sector. It’s this: the average S&P sector returned +1.8% since June 1. The S&P 500 itself returned −1.7%. Same five hundred companies, same six weeks, three and a half percentage points apart. Every one of those points is the scale, not the crowd. You’ve got to read this paragraph again and understand it, it’s crucial narration for what we’re seeing right now.
Six weeks. Eleven sectors, seven of them positive, and the “market” was down. If you have ever wondered whether the index is a good description of the stocks in it, there’s your answer, and it’s not a close call.
What actually got sold — and why good news couldn’t stop it
Memory chips. And not gently.
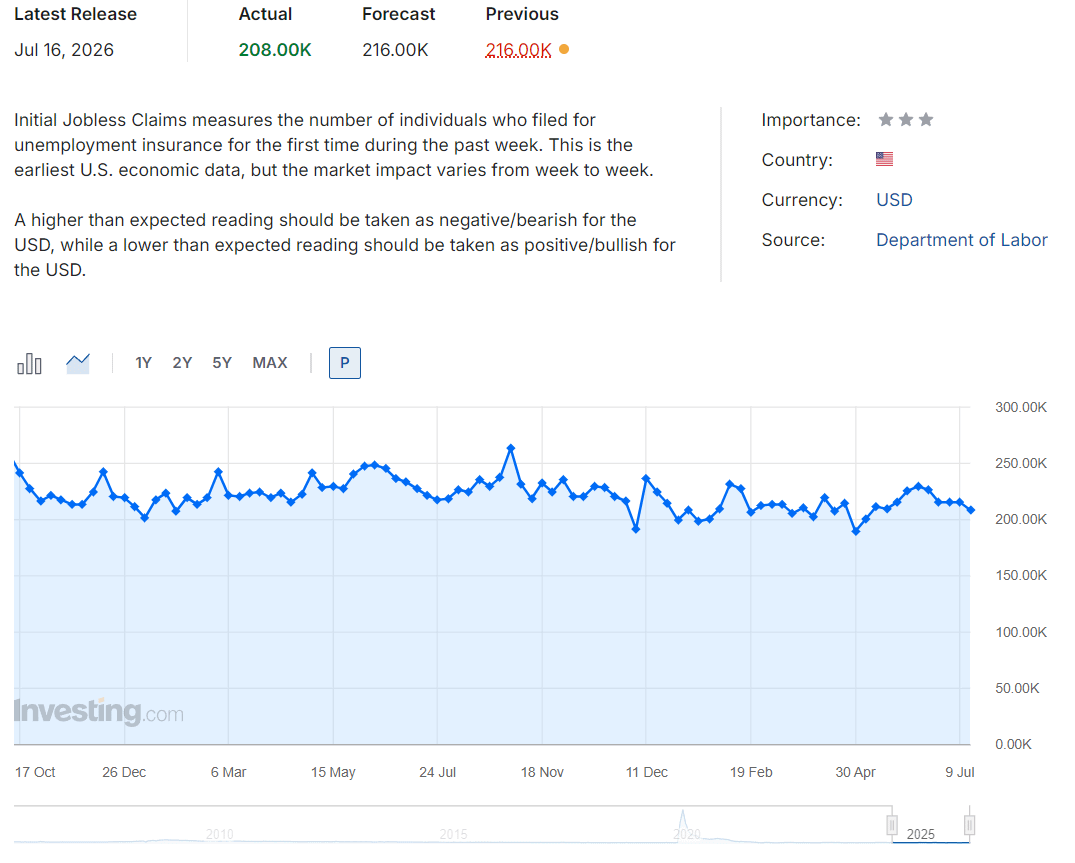
The thing dragging the heavy end down wasn’t the American economy — the American economy had a lovely week. Jobless claims fell to 208,000, the lowest since early May. Retail sales rose, and rose more once you strip out the falling gas prices. The banks kicked off earnings season and JPMorgan, Citi, and Goldman all pointed to resilient loan growth and solid credit. That’s not a market in trouble. That’s a market in fine shape wearing a bad hat.
What got sold was the AI infrastructure complex, globally, all at once. Korea’s memory giants took heavy selling. Japan’s Nikkei dropped 6.4%. Chinese semis reversed hard. And — this is the part worth understanding — it happened despite good news from the actual companies. Taiwan Semiconductor and ASML, the two most important suppliers in the entire chain, both reported encouraging results. The complex sold off anyway.
When good earnings can’t stop the selling, you’re not watching an earnings story. So what is it?
Here’s the number that explains it. AI capital spending is expected to grow 75% this year, to somewhere between $700 and $800 billion. Enormous. Historic. And the forecast for the year after that is 25% growth. And the year after that, 6%.
Read that again slowly. The spending never falls. It keeps growing, every year, forever, as far as anyone can see. What collapses is the growth rate — 75%, then 25%, then 6% — and the growth rate is what everybody paid for. You don’t sell a semiconductor stock because the checks stop clearing. You sell it because the second derivative rolled over and you’d rather be the first one out. Semis are down about 20% from their highs. They’re also still up about 64% on the year. Both of those are the same sentence.

VL outlier table caught the unwind at the print level, which is the part that’s hard to see from outside. The memory-linked ticker DRAM showed up fifteen times across four sessions at extreme sizes. SK Hynix — the exact Korean memory name at the center of it — appeared six times, once at 29 standard deviations above its normal trade size. The leveraged semiconductor ETFs churned nonstop: the 3x bull semis fund printed thirteen outliers, the 3x bear semis fund five, the 3x bull Nasdaq fund ten. Bulls and bears both levering up, on the same names, in the same week, at sizes that don’t happen by accident. That’s not investing. That’s a knife fight.
It got wild enough that Korean regulators temporarily restricted new single-stock leveraged ETF products, on the theory that products designed to triple your exposure to a falling knife might, in some small way, be contributing to the volatility. I have no notes.
The scale inside the scale
And now the fractal version of the whole idea, which is my favorite thing I learned this week digging into the data.
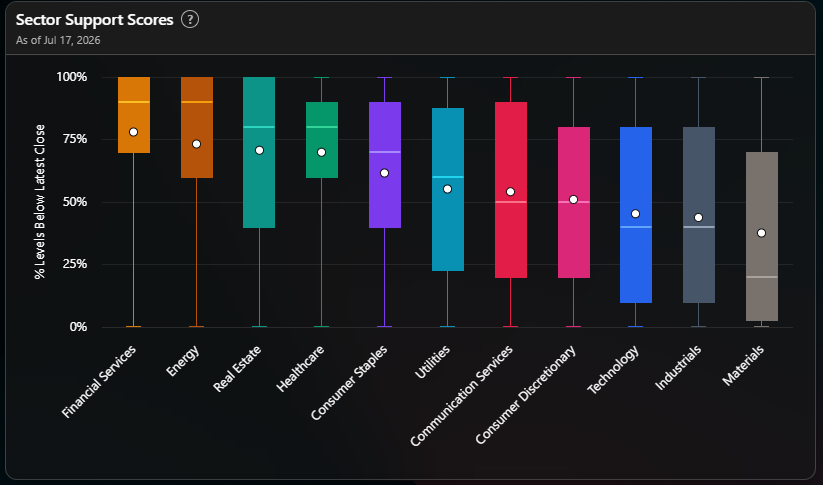
I keep telling you “Technology is at the bottom of my board, 47.8%.” That’s true. It’s also a scale reading — one number standing in for a lot of unlike things, exactly like the index it sits inside. Weigh it and you learn what it weighs. You don’t learn what’s in it.
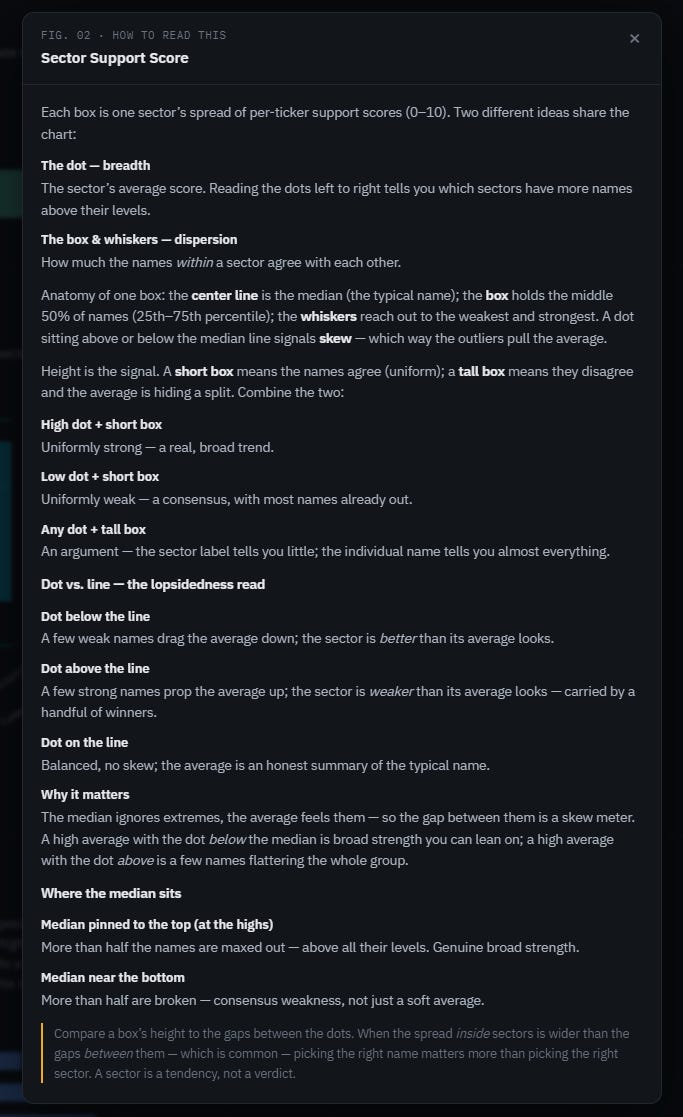
(A reminder on how to read this)
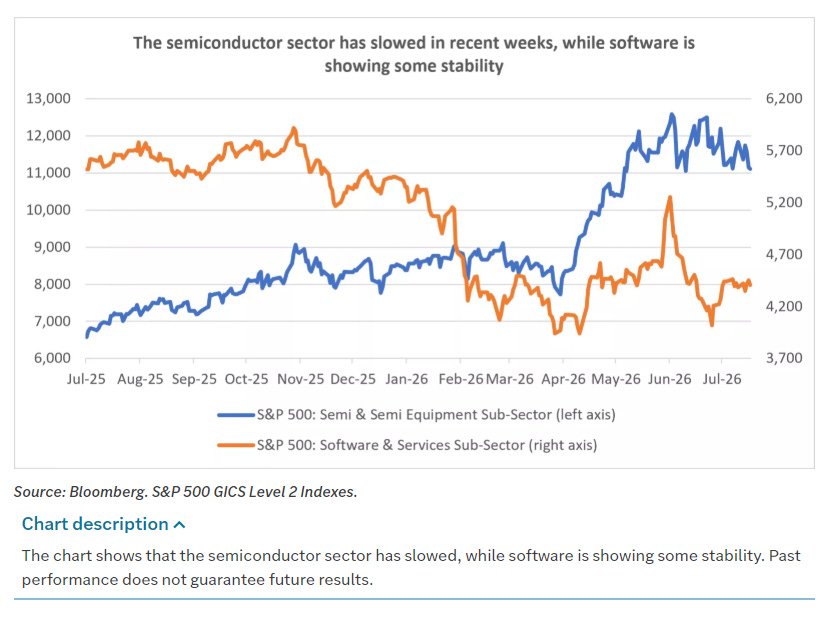
So when you open the technology box, what you find is that there’s a second rotation: the semiconductor and hardware half of tech is getting crushed, while software and cloud are quietly recovering. Microsoft and Salesforce rebounding; AI infrastructure lagging.
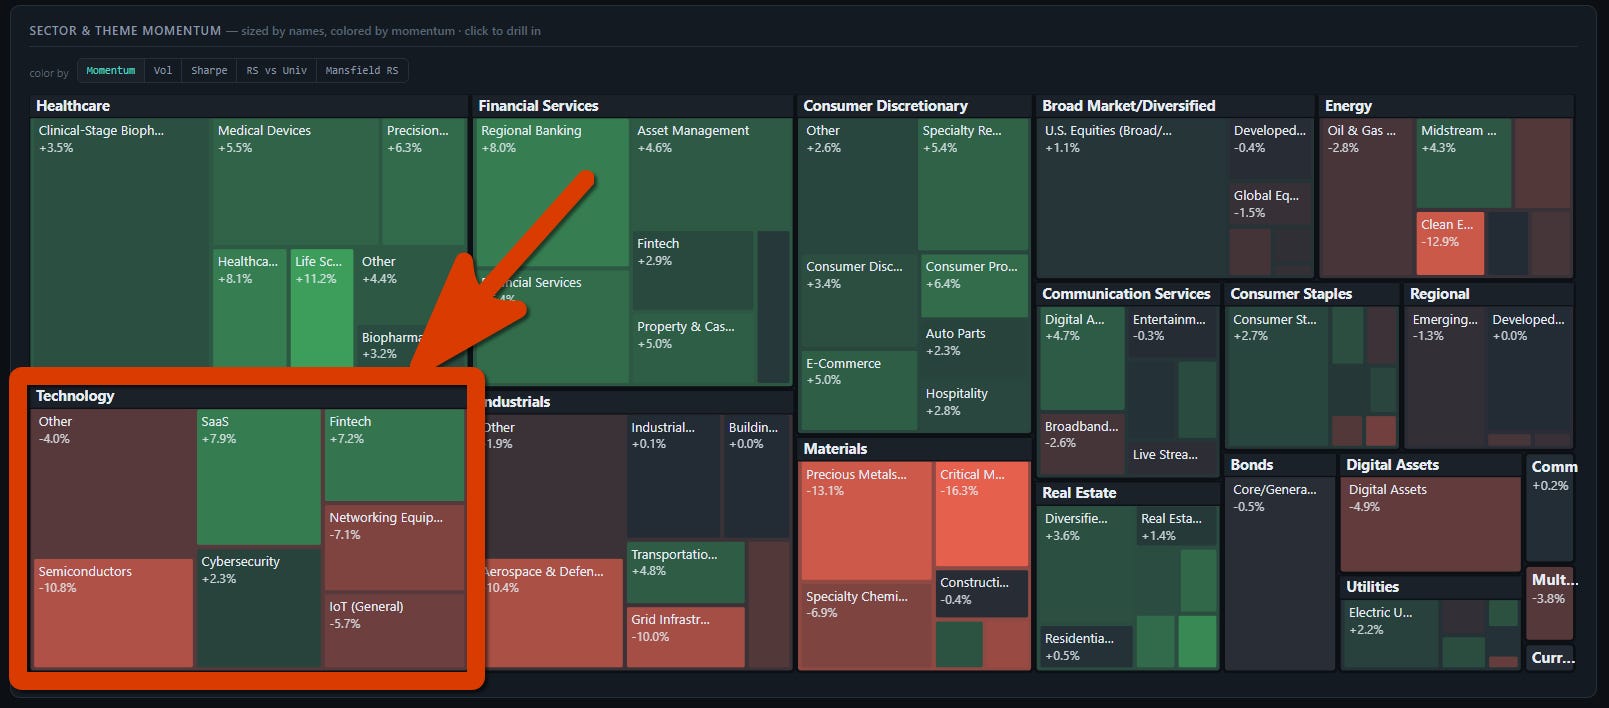
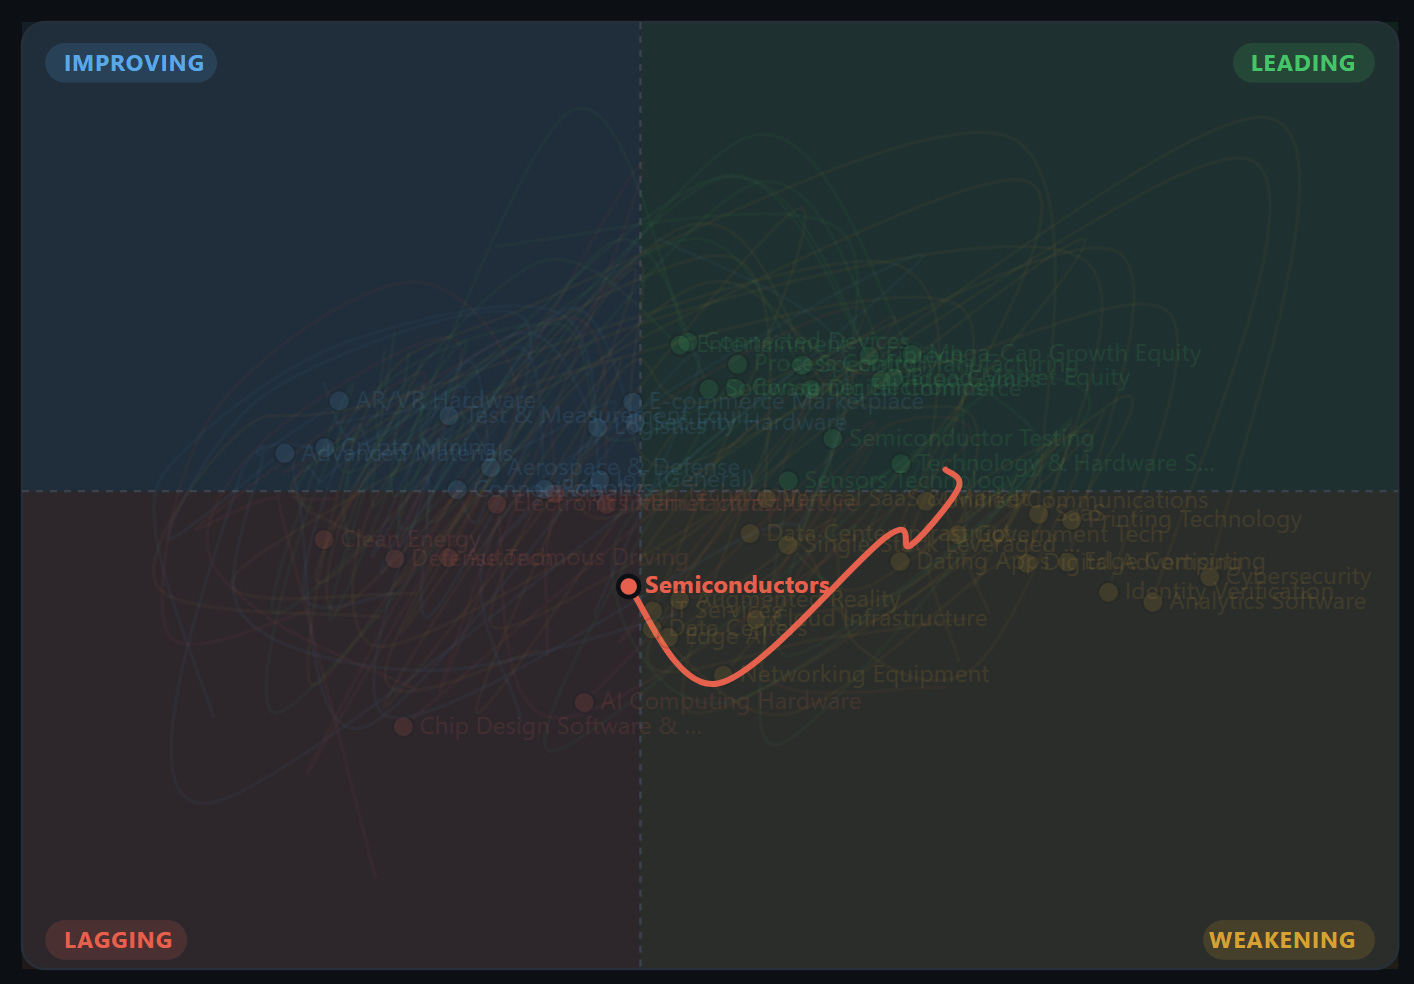
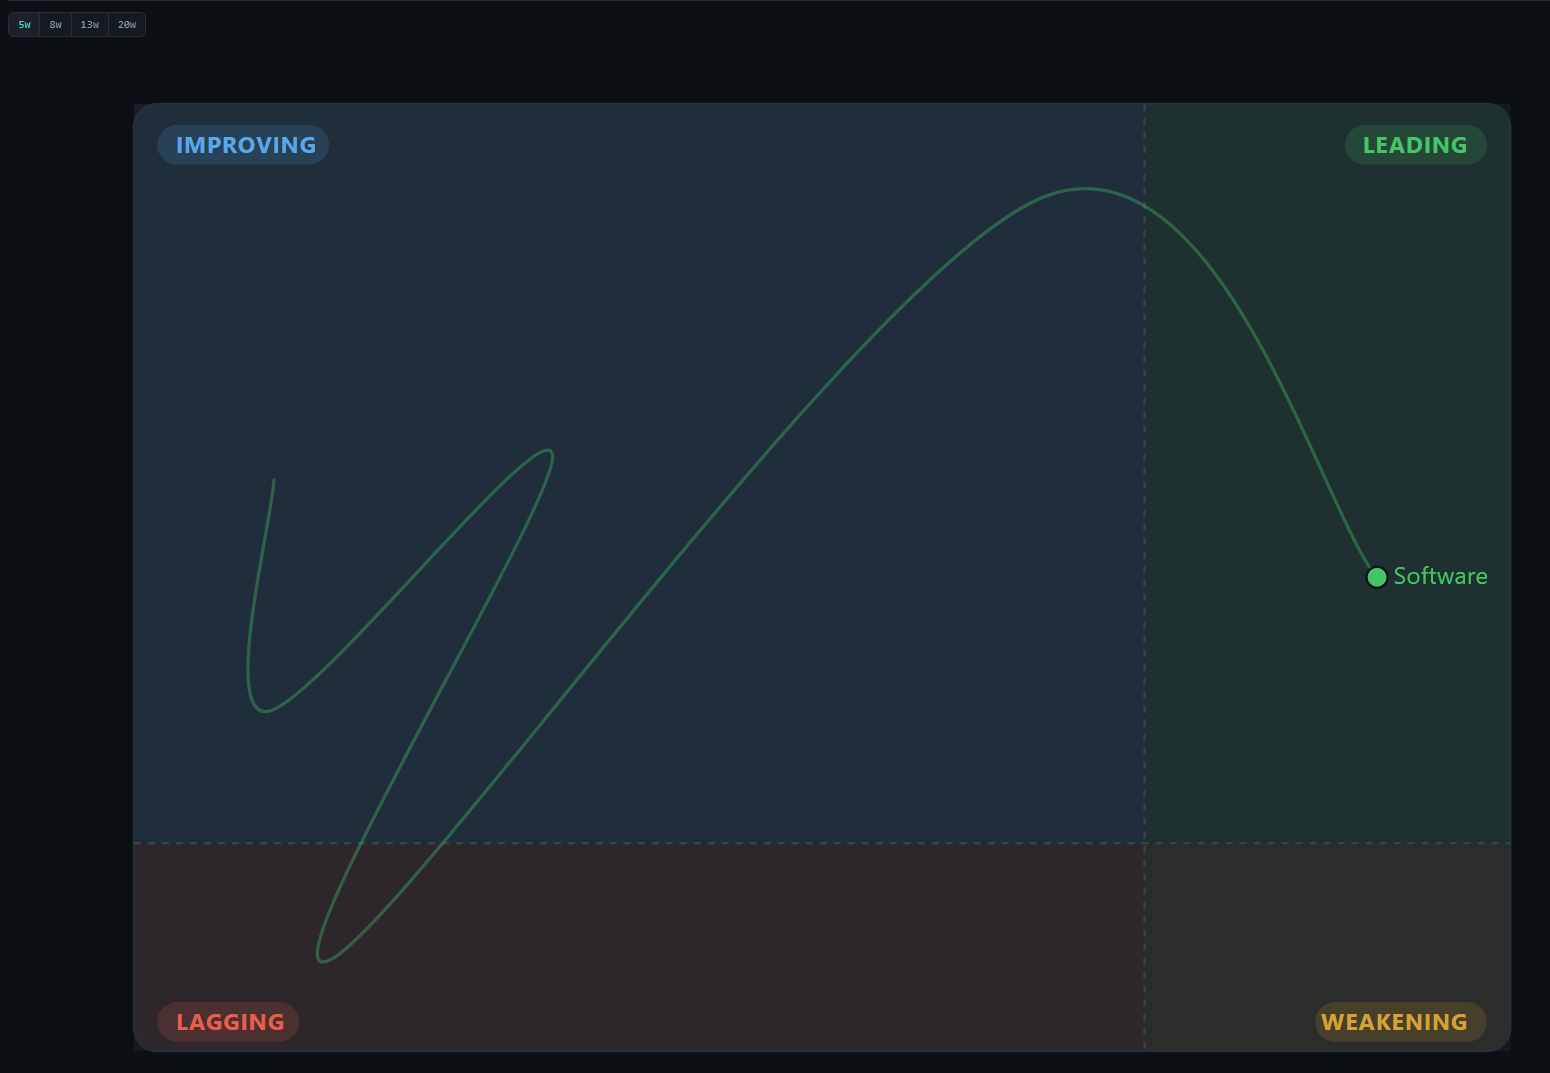
So “the market fell” hides “tech fell and everything else rose.” And “tech fell” hides “chips fell and software rose.” Every number you get handed is a scale reading of something nobody opened. That’s not a reason to despair. It’s the reason this job exists.
Friday: the machine takes its cut
Then Friday, breadth gave back a chunk — 63.3% down to 58.8% — and that give-back has an asterisk.
Friday was monthly options expiration, and the VL outliers table that day looks nothing like the rest of the week. The most extreme prints weren’t companies at all. They were index vehicles: a broad commodity fund at 84 sigma, another at 77, the small-cap Russell fund twice at 51 and 50, a mid-cap fund twice at 44 and 34, a mid-cap value fund, a large-cap growth fund, and — my favorite — an inverse Russell 2000 fund at 30 sigma. That’s not a thousand fund managers changing their minds about America. That’s the expiration machine doing its monthly paperwork in the last hour.
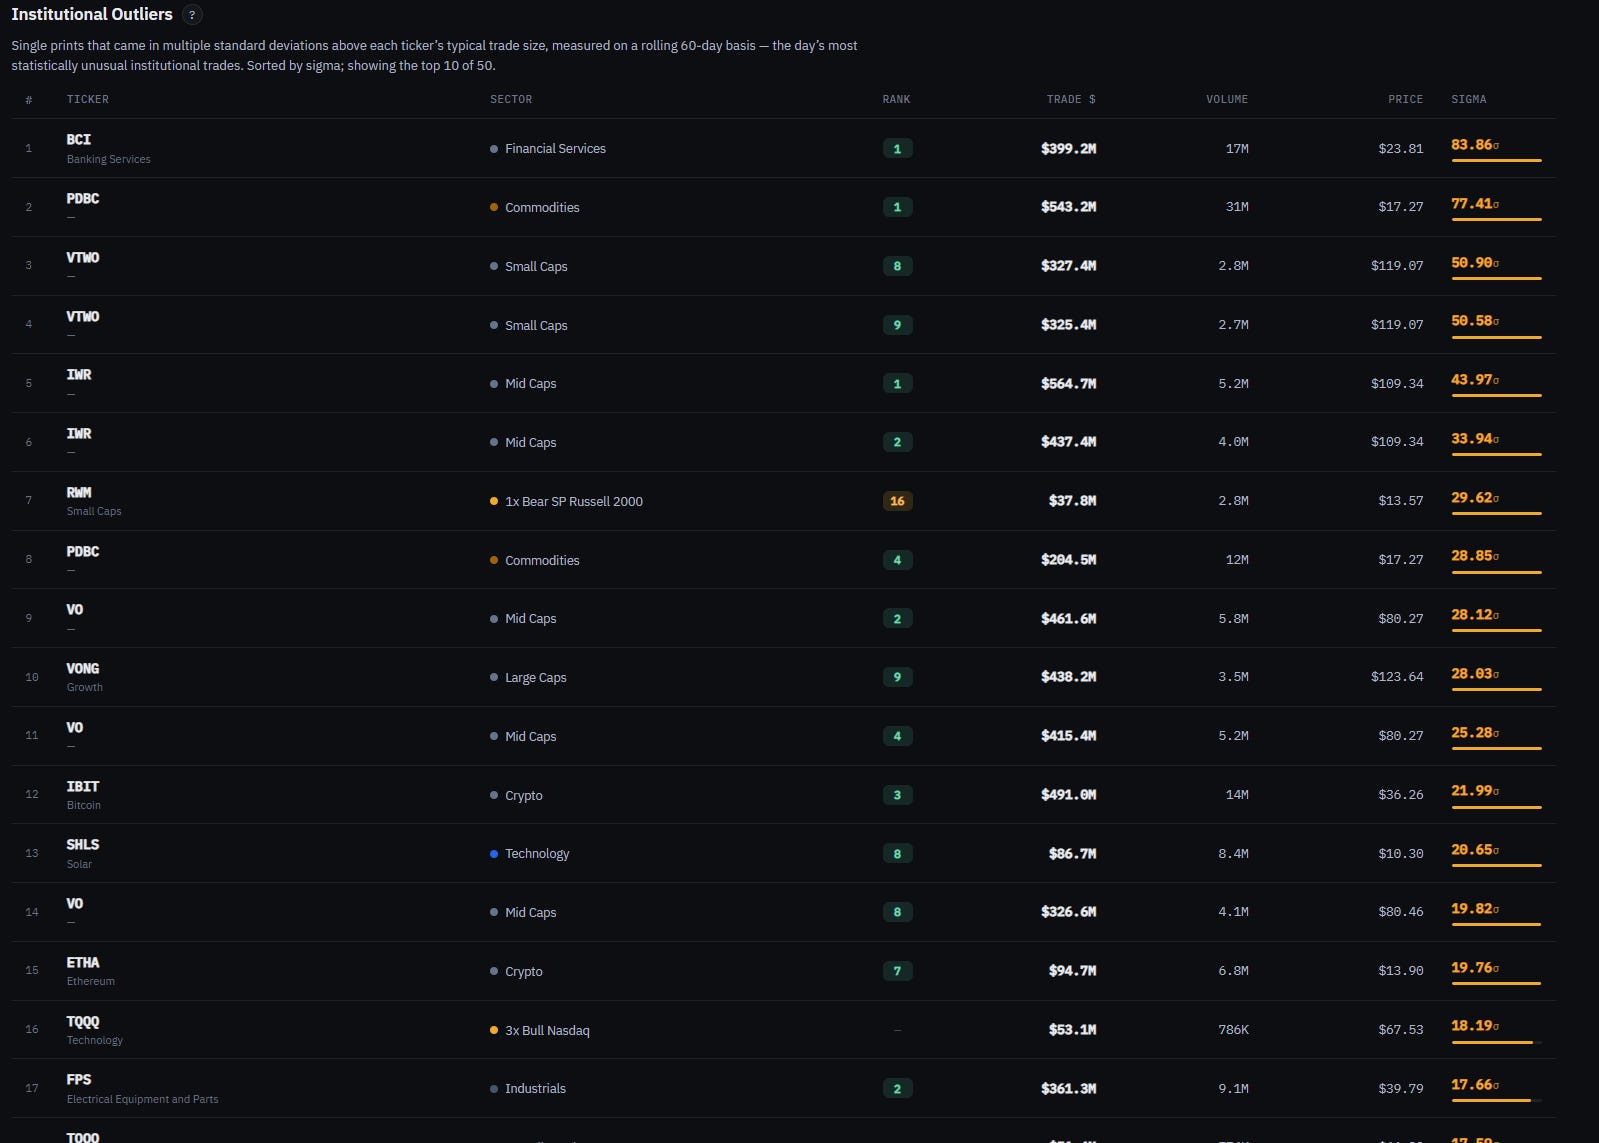
So read Friday lightly. Thursday was the market talking. Friday was the plumbing. And by way of major liquidity events, it wasn’t much to write home about compared to recent big liquidity days:
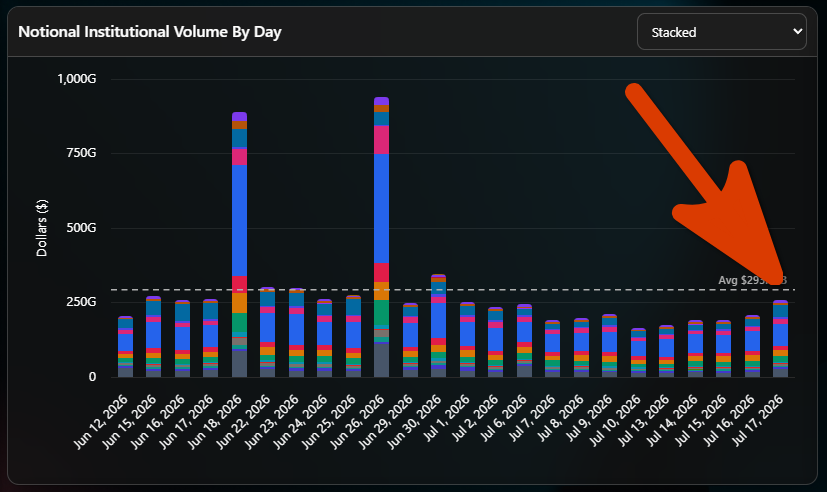
Energy, twice in a row
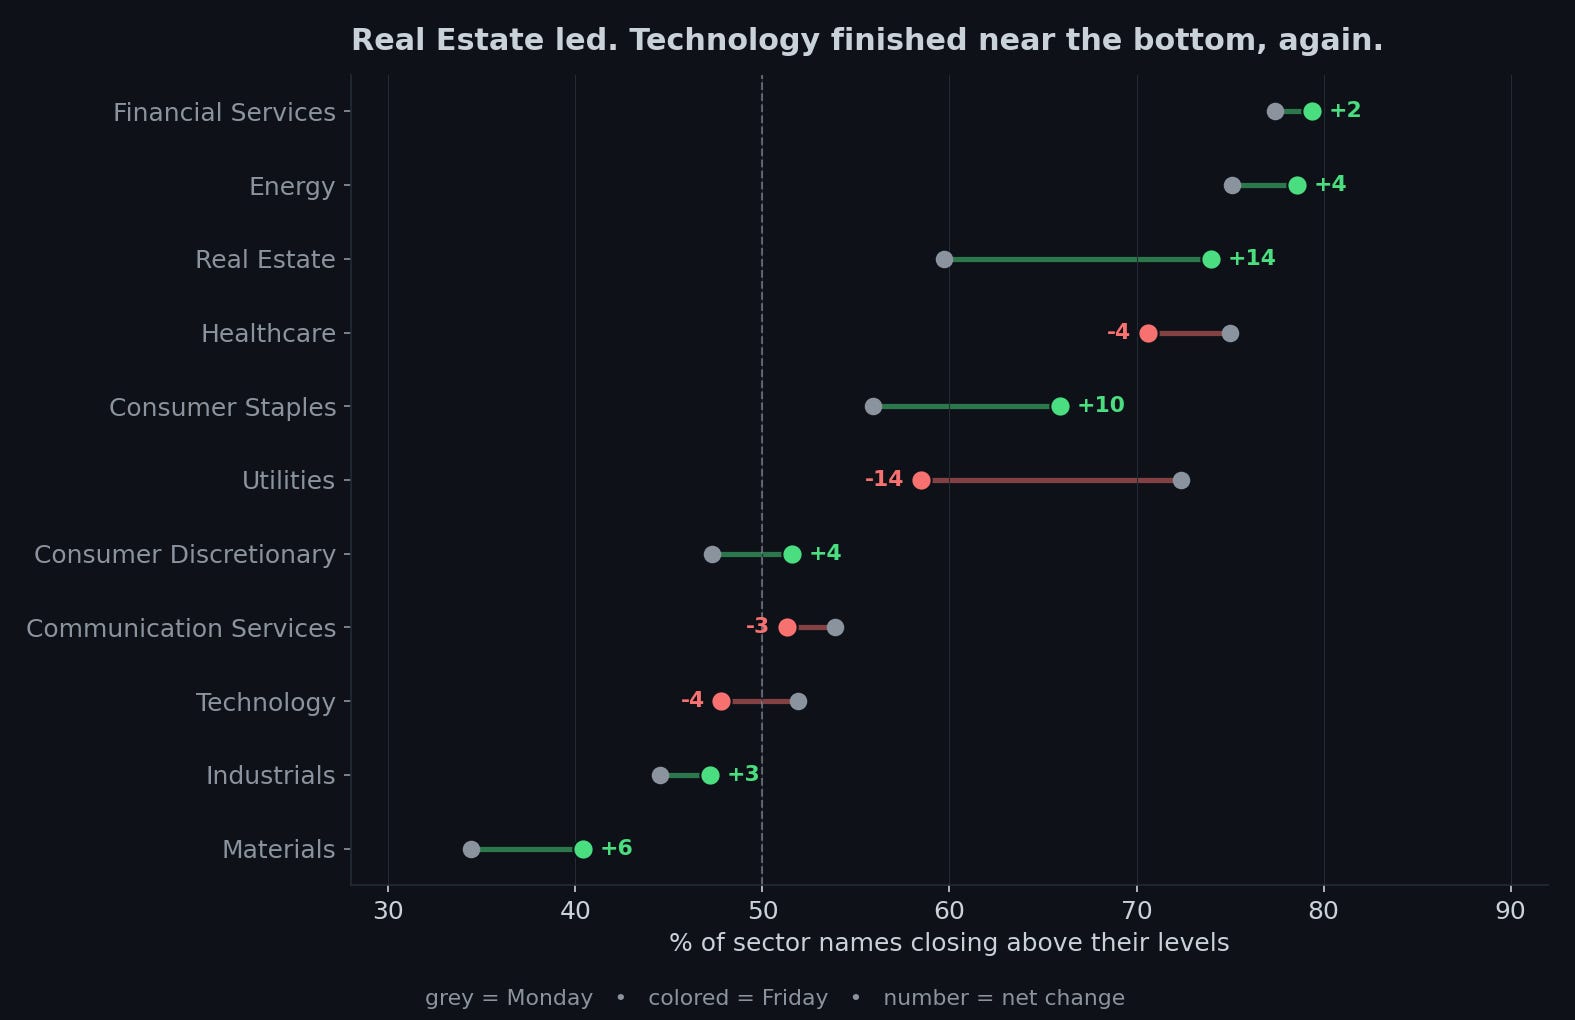
One sector has been the cleanest thing on my board two weeks running: Energy — the only sector that rose into Friday’s fade, finishing near the top at 78.6%.
The reason is the same as last week and still refreshingly stupid in its simplicity: the U.S.–Iran situation keeps escalating, oil keeps getting bid, and companies that sell oil keep going up. Three weeks ago I was scratching my head because Energy support was rising while crude was falling. That puzzle is thoroughly dead.
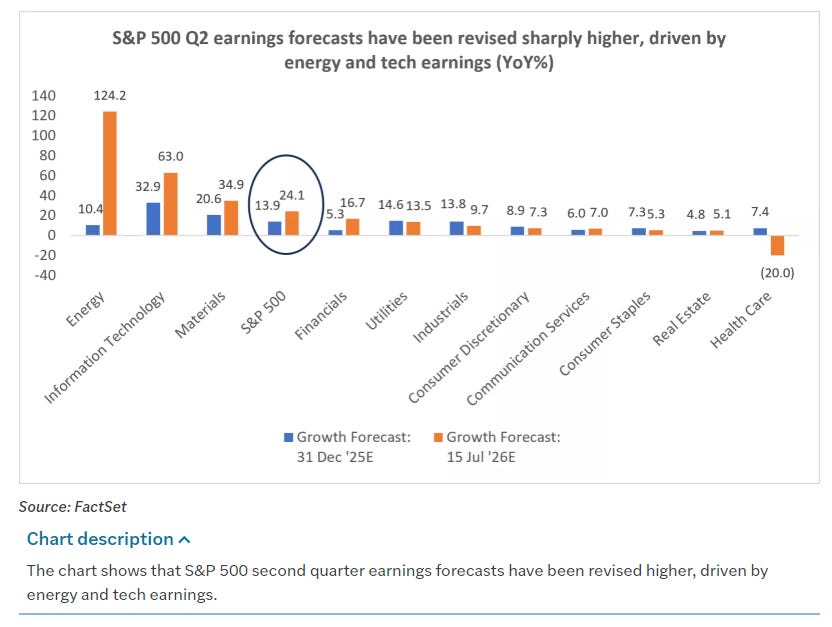
There’s a fundamental leg under it too, and it’s a monster: Energy’s expected second-quarter earnings growth has been revised from about 10% to 124%. Not a typo. Together with technology, energy is doing most of the work lifting the S&P’s whole earnings forecast from roughly 14% to 25%. Oil up, Energy up, earnings up. Sometimes the market is exactly as complicated as it looks.
Real Estate was the week’s biggest breadth gainer (+14) on the rate relief. Financial Services held the top spot (79.4%) through the bank beats. Technology finished near the bottom at 47.8% — the fourth week running.
The honest tension
Here’s the crossroads the data has lead us to this week:
The bullish version: this is what a healthy handoff looks like. The most crowded, most globally-owned trade on earth is unwinding — and the rest of the market is absorbing it. Cool inflation, rate-hike odds cut to 14%, banks beating, claims at multi-month lows, 58.8% of stocks above the prices institutions defend, and seven of eleven sectors positive over six weeks. It’s completely feasible that the appetite for stocks stays robust because earnings keep delivering. The AI complex is deflating and nothing else is breaking. That’s the best available version of this.
The cautious version: The market is adopting a defensive tilt just as the seasonal summer-rally window nears its average peak, with the S&P stuck in a range and printing a double top. Housing is deteriorating — pending sales −5.4%, mortgage rates at 6.55%, the highest since last August. Consumers are pulling back on big-ticket items. Oil has already climbed back since the good CPI print, which means Thursday’s gift is partly being taken back as we speak. The Fed is split down the middle — half the committee thought a hike was appropriate in June — and the next meeting is July 29. And a memory unwind that takes 6.4% out of the Nikkei in five days is not obviously finished.
The tell that settles it is specific and cheap to watch: does breadth hold above the high-50s while tech keeps bleeding? If Technology stays pinned near 45–50% and my overall support score holds 58–60%+, the market is genuinely absorbing the unwind — the rest of the market really is carrying the weight without its heaviest names, and you can trust the broad tape over the headline. If instead support slides toward the low 50s and the rate-sensitives hand back Thursday’s gift, then the megacaps were never separable from everything else, and the healthy-rotation story dies. Watch the gap between my breadth number and the Nasdaq. This week it was enormous. Next week it either holds or it closes.
(A reminder on how to read this)
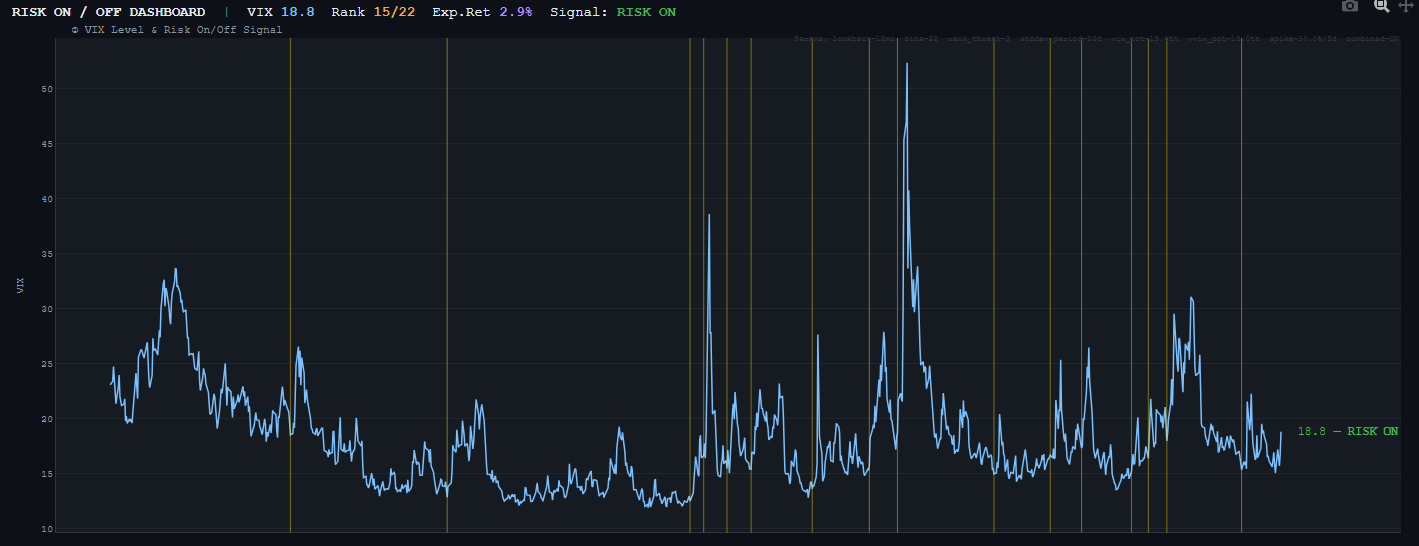
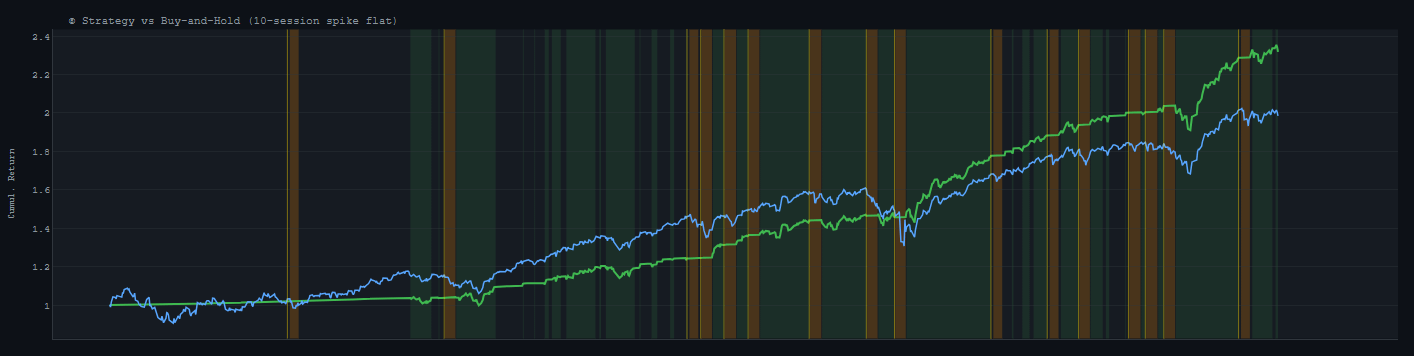
Our VIX signal still says risk-on and it’s got a pretty good history of firing before some nasty drawdowns, if anything changes in coming sessions I’ll post a note for subscribers so hit that sub-button:
What this means, by your clock
If you trade in days to weeks: stop reading the Nasdaq as a proxy for anything but the Nasdaq. The rate-sensitives got a real catalyst and Thursday showed you exactly which names respond to it. Energy has an active geopolitical bid and a 124% earnings revision behind it. Financials are in the meat of earnings. But respect Friday’s give-back, respect oil creeping back up, and don’t confuse an OpEx print for a signal.
If you invest in months to years: this week was a free and vivid lesson in something easy to nod at and hard to feel — your index fund is not diversified the way you think it is. A week where the average stock rose and your S&P fund fell is a week where concentration risk stopped being theoretical and showed up on your statement. That’s not an argument to sell anything; the S&P is still up about 10% on the year after three straight years of double-digit gains. It’s an argument to know what you own. Check that you’re diversified across the tech and non-tech halves of the market — which is a polite way of saying the same thing my board has been shouting for a month. When you’ve got good data, there are clear arguments to have cash deployed in tactically in specific corners of the market right now:
The through-line, and it’s the oldest one I’ve got: what people say is “the market fell.” What the money did was buy nine hundred and sixty-five stocks’ worth of everything-that-isn’t-AI, on the same day the headline went red. The average is not the thing. It never was.
Have a good week out there. Wishing you cool inflation prints, patient positions, and the healthy reflex to ask “which market?” every single time somebody tells you what the market did.

Thank you for being part of this community and for investing your time in this week’s edition. The quality of this readership — thoughtful, disciplined, engaged — is what makes this work meaningful. I’m grateful to build alongside you. Here’s to a week of clarity, conviction, and well-executed opportunities.
— VolumeLeaders